3D view
The 3D view draws trajectories of a flow against three of its states inside a box you can turn and zoom (Strogatz chapter 9). Choose 3D in the View panel. It is offered for a flow with three states or more.
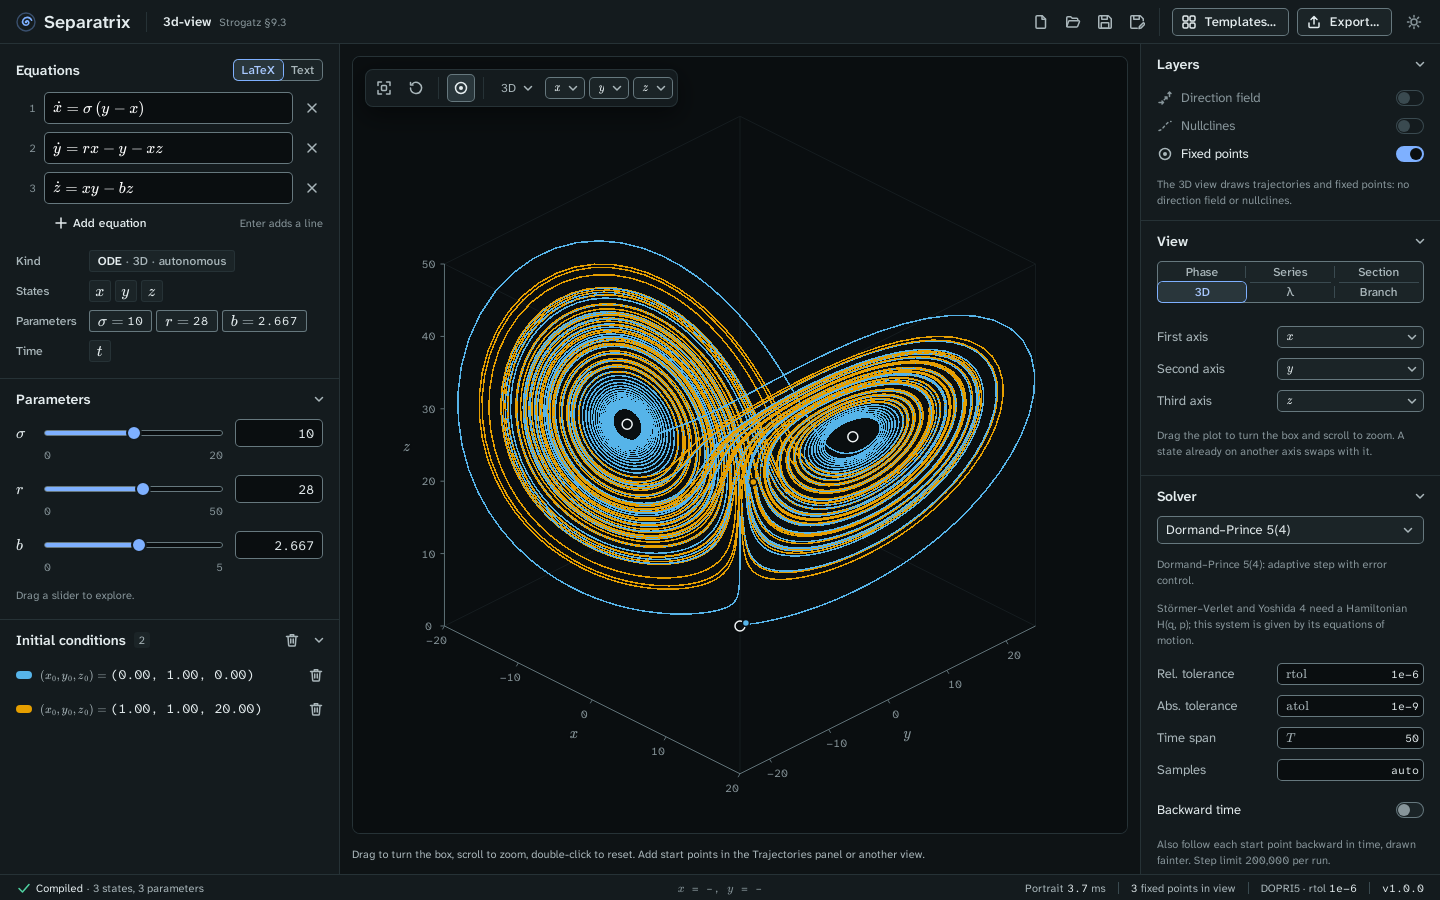
Example project: 3d-view.sepx, the Lorenz equations of Strogatz §9.3 at σ = 10, r = 28 and b = 8/3, with two trajectories on the attractor and the three fixed points. They are the origin, and C⁺ and C⁻ at the centers of the two wings.
Turn and zoom
- Drag the plot to turn the box.
- Scroll to zoom.
- Double-click to go back to the starting camera.
- With the plot focused, the arrow keys turn the box by 5°, or 15° with Shift. Plus and minus zoom, and 0 resets the camera.
The camera is saved in the project file, so the box opens the way you left it.
Choose the states
The View panel has First axis, Second axis and Third axis menus, and the plot's toolbar has the same three menus. Choosing a state that is already on another axis swaps the two.
Add trajectories
You can't click a point in three dimensions, so the 3D view has no click-to-add. Add start points in the Trajectories panel, or switch to the phase plane, click there, and switch back. The Initial conditions panel lists every start point with its three coordinates.
What the view leaves out
The 3D view draws trajectories and fixed points only, with no direction field and no nullclines. On a computer without WebGL, it draws the trajectories on a plain canvas and says so. They are then redrawn when you stop dragging.
Export
PNG and SVG show the box from your camera. The LaTeX figure is not available for the 3D view. LaTeX equations, the fixed-point table and CSV work as in any other view. See Export figures and data.