Separatrix
A free desktop app for exploring dynamical systems: type a system the way you write it on the board, and watch its phase portrait change as you drag a parameter.
For students and professors of mathematics and physics. Windows, macOS and Linux. Works offline.
Download
Free and open source, MIT license
Opens the releases page on GitHub.
macOS
Apple silicon or Intel
- Disk image (.dmg) Universal: one file for Apple silicon and Intel Macs.
Windows
Windows 10 or 11, 64-bit
- Installer (.exe) The standard installer. It downloads WebView2 if the PC lacks it.
- Offline installer (.exe) For PCs without internet, or that can't download WebView2. It carries WebView2 inside, so it is much larger.
- MSI package (.msi) For IT deployment to every user of a PC. Needs an administrator.
Linux
64-bit Intel or AMD, distributions from 2022 on
- AppImage One file that runs without installing, on most distributions.
- Debian package (.deb) Ubuntu, Debian, Linux Mint and Pop!_OS.
- RPM package (.rpm) Fedora, openSUSE and other RPM distributions.
SHA256SUMS.txt lists the SHA-256 checksum of every file. · All releases
What you can do
The View control in the right-hand panel switches between views. A flow offers Phase, Series, Section, 3D, λ, Branch and Parameter plane. A map offers Phase, Series, Cobweb, λ, Orbit, Branch and Parameter plane. A view that doesn't fit the system is grayed out, and the panel says why. Each guide page below links an example project that opens in that view.
-
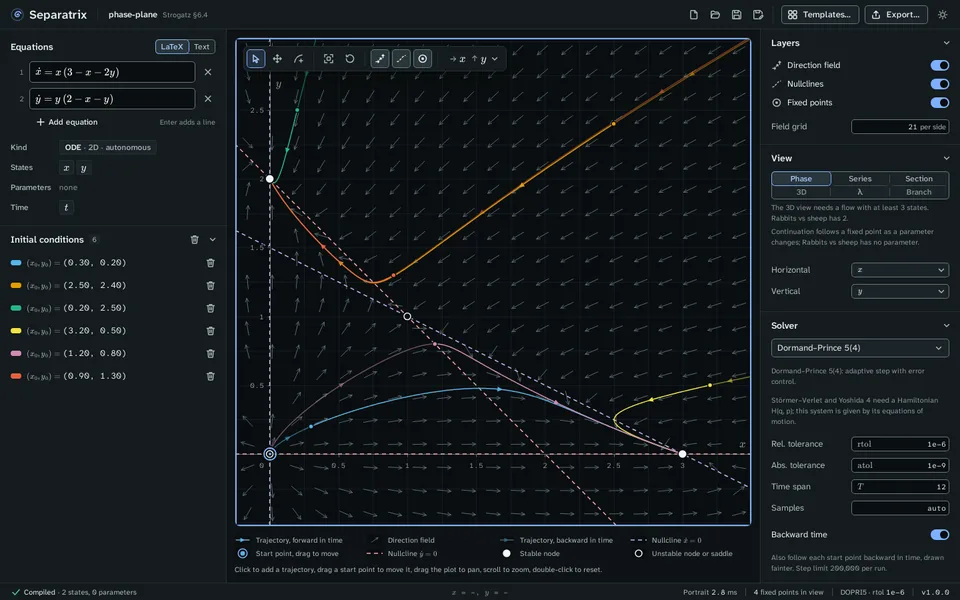
Phase plane
The phase plane draws trajectories of a system with two or more states against two of them, with the direction field, the nullclines and the fixed points.
Example: Rabbits vs sheep, Strogatz §6.4
-
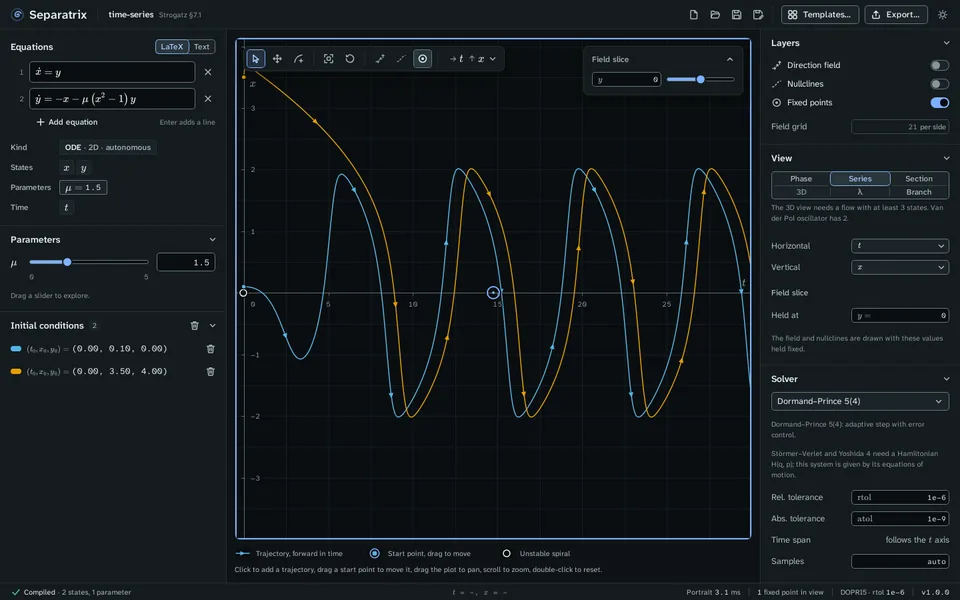
Time series
The time series view plots a state against time,
tfor a flow ornfor a map, for every trajectory.Example: Van der Pol oscillator, Strogatz §7.1
-
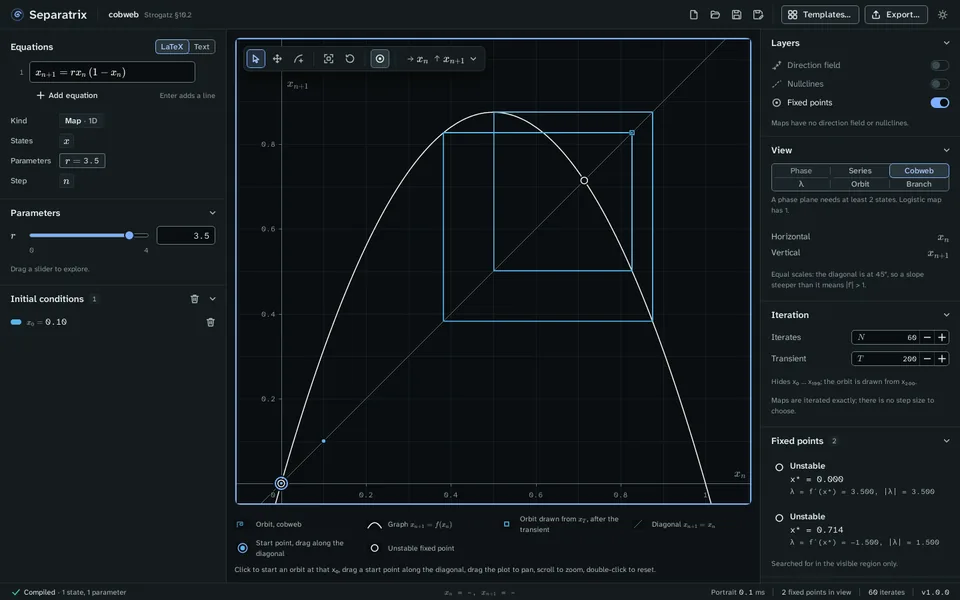
Cobweb
The cobweb view draws the graph of a one-dimensional map xn+1 = f(xn), the diagonal xn+1 = xn, and the staircase of each orbit between them (Strogatz §10.1).
Example: Logistic map, Strogatz §10.2
-
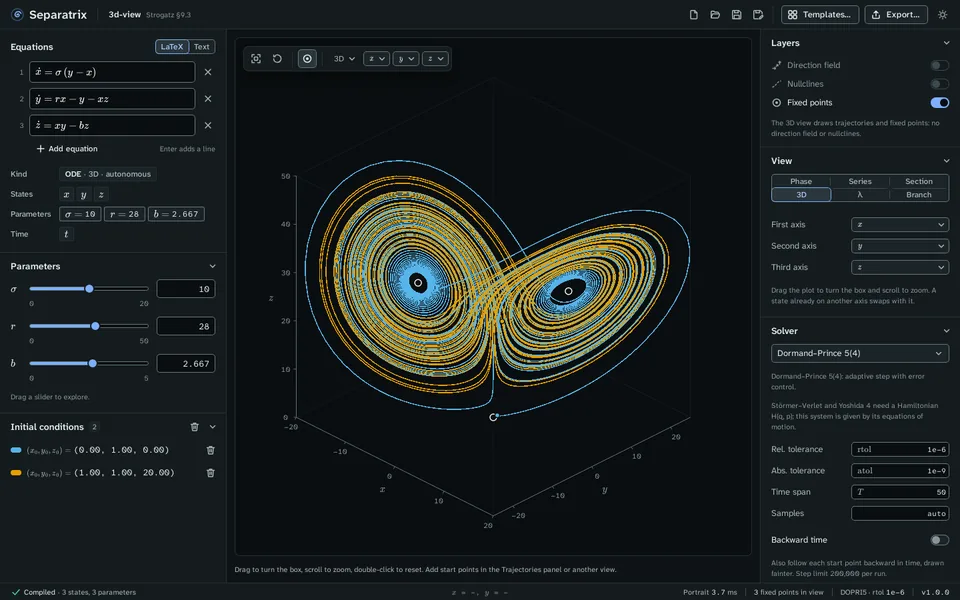
3D view
The 3D view draws trajectories of a flow against three of its states inside a box you can turn and zoom (Strogatz chapter 9).
Example: Lorenz equations, Strogatz §9.3
-
Poincaré section
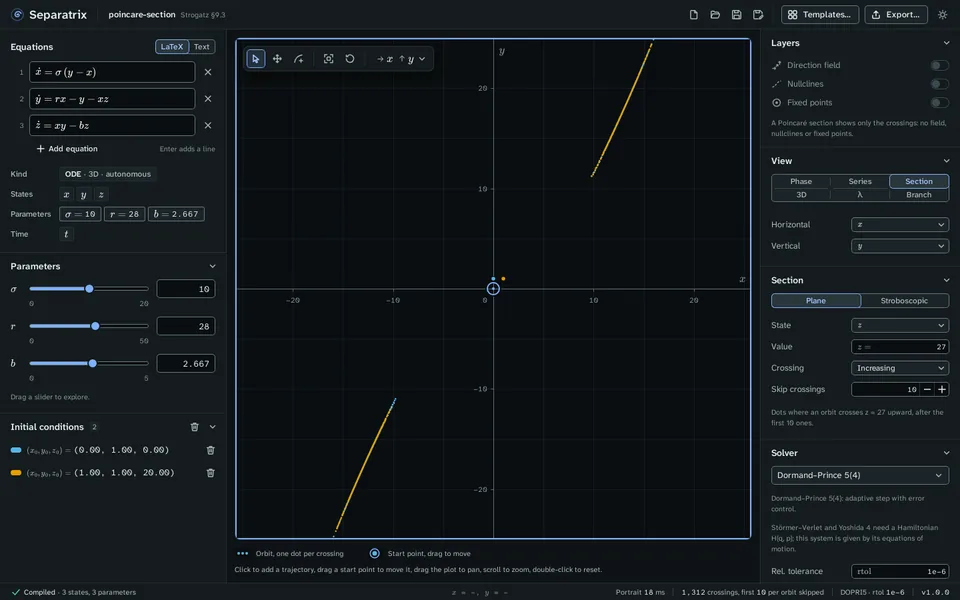
A Poincaré section shows where a flow's orbits cross a plane, one dot per crossing (Strogatz §8.7).
Example: Lorenz equations, Strogatz §9.3
-
Lyapunov spectrum
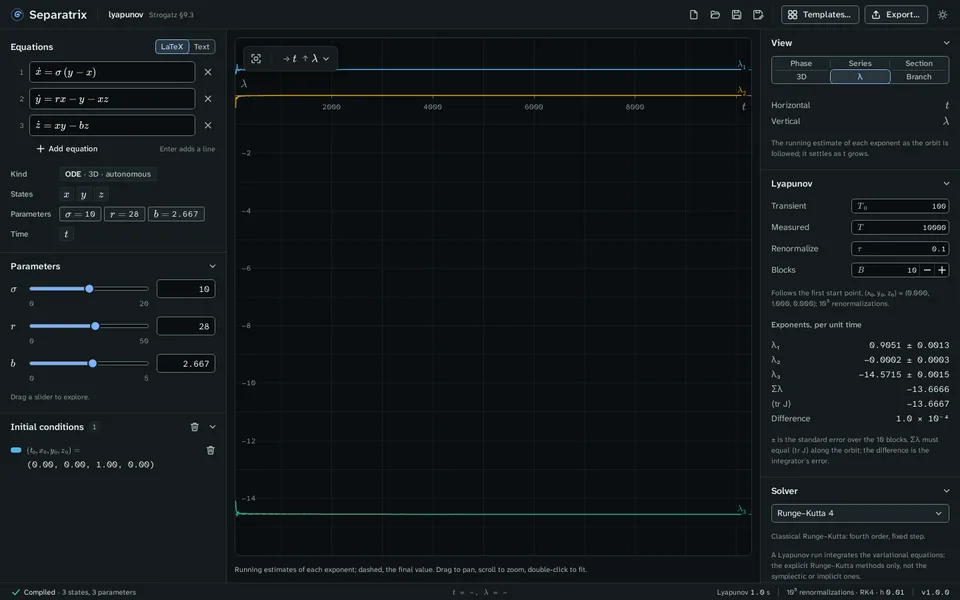
The Lyapunov view measures every Lyapunov exponent of a flow or a map along one orbit, and plots the running estimate of each exponent against t or n (Strogatz §9.3 and §10.5).
Example: Lorenz equations, Strogatz §9.3
-
Orbit diagram
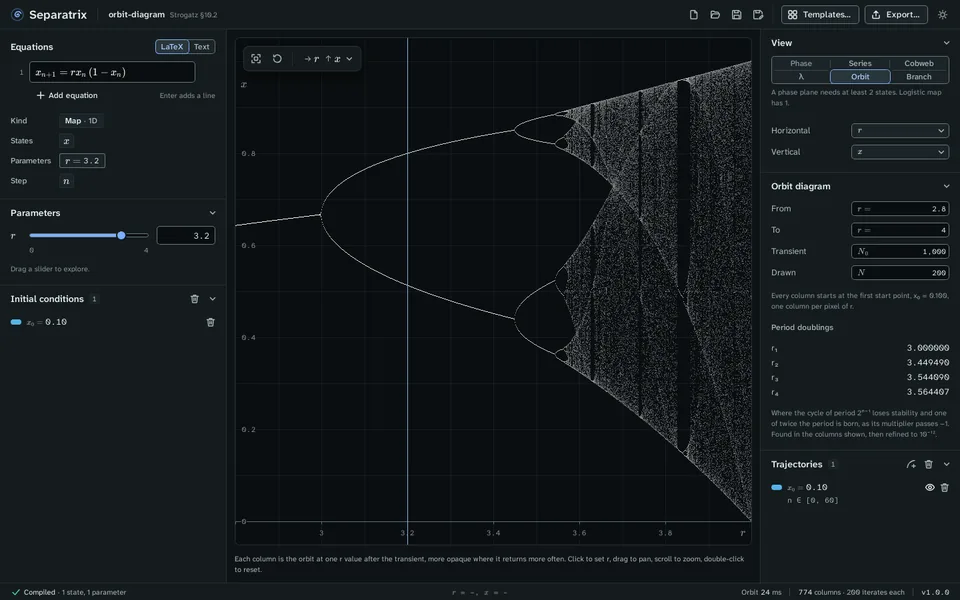
The orbit diagram iterates a map at many values of one parameter and draws, above each value, the iterates left after a transient (Strogatz §10.2, Figure 10.2.7).
Example: Logistic map, Strogatz §10.2
-
Continuation
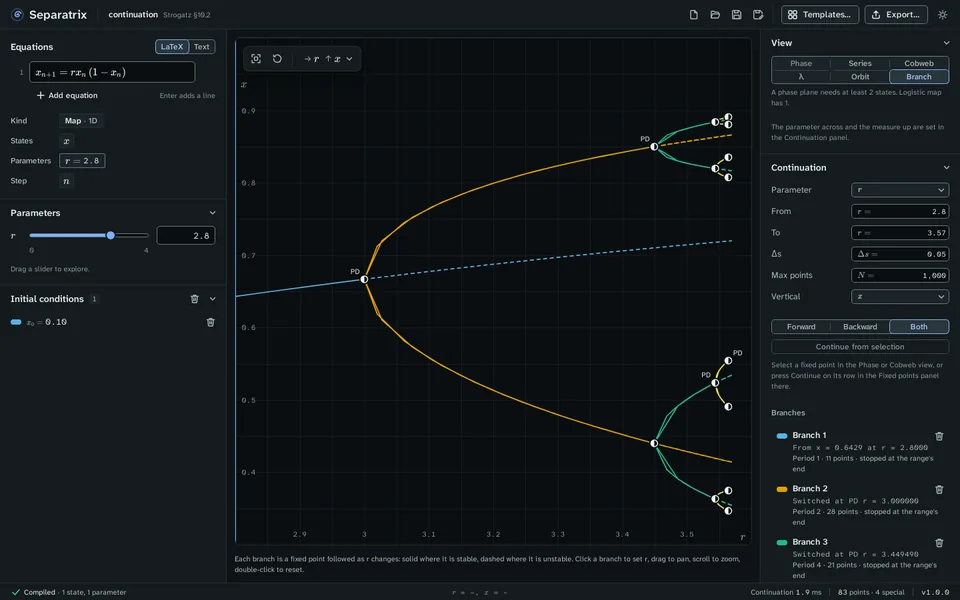
The Branch view follows a fixed point, of a flow or of a map, as one parameter changes, and marks the bifurcations it passes.
Example: Logistic map, Strogatz §10.2
Examples
Download a project and open it with Open…, or drop it on the Separatrix window. Each file is a few kilobytes: it holds the equations, the start points and the view, and Separatrix recomputes the rest.
| Project | System | Source | Opens in | Size |
|---|---|---|---|---|
| phase-plane.sepx | Rabbits vs sheep | §6.4 | Phase plane | 1.9 KB |
| time-series.sepx | Van der Pol oscillator | §7.1 | Time series | 1.4 KB |
| cobweb.sepx | Logistic map | §10.2 | Cobweb | 1.3 KB |
| 3d-view.sepx | Lorenz equations | §9.3 | 3D view | 2.2 KB |
| poincare-section.sepx | Lorenz equations | §9.3 | Poincaré section | 2.1 KB |
| lyapunov.sepx | Lorenz equations | §9.3 | Lyapunov spectrum | 1.7 KB |
| orbit-diagram.sepx | Logistic map | §10.2 | Orbit diagram | 1.3 KB |
| continuation.sepx | Logistic map | §10.2 | Continuation | 2.7 KB |
The app also opens on a gallery of 33 examples from chapters 2 to 10 and 12 of Strogatz's Nonlinear Dynamics and Chaos (2nd edition), grouped by chapter. Click a card to start from that system.
Why Separatrix
Works offline
Separatrix needs no internet connection after you install it. The solvers and the plots run on your computer.
LaTeX first
Copy a pgfplots figure, the system in an
alignenvironment, or a booktabs table of fixed points, Lyapunov exponents or bifurcations, ready for your notes. SVG, PNG and CSV too.Strogatz's notation
Type
\dot{x}andx_{n+1}as on the board in LaTeX, orx'in plain text. Filled dots are stable fixed points and open circles unstable ones, named in his words: stable spiral, saddle, center.Projector mode
A light theme with type 15% larger and plot lines 1.75 times as thick, so a plot reads from the back of a lecture hall.
Small project files
A
.sepxfile holds what you typed and chose, not computed data, so it is a few kilobytes and travels by email or a course platform.Checked against the book
Three gates check the numbers on every change: Strogatz's chapter 2 to 8 results, published Lyapunov exponents and closed-form bifurcation points. For Lorenz, λ1 = 0.9051 ± 0.0013 against Sprott's 0.9056.