Continuation
The Branch view follows a fixed point, of a flow or of a map, as one parameter changes, and marks
the bifurcations it passes. Choose Branch in the View panel. It is offered for a system
with a parameter whose equations don't contain t or n.
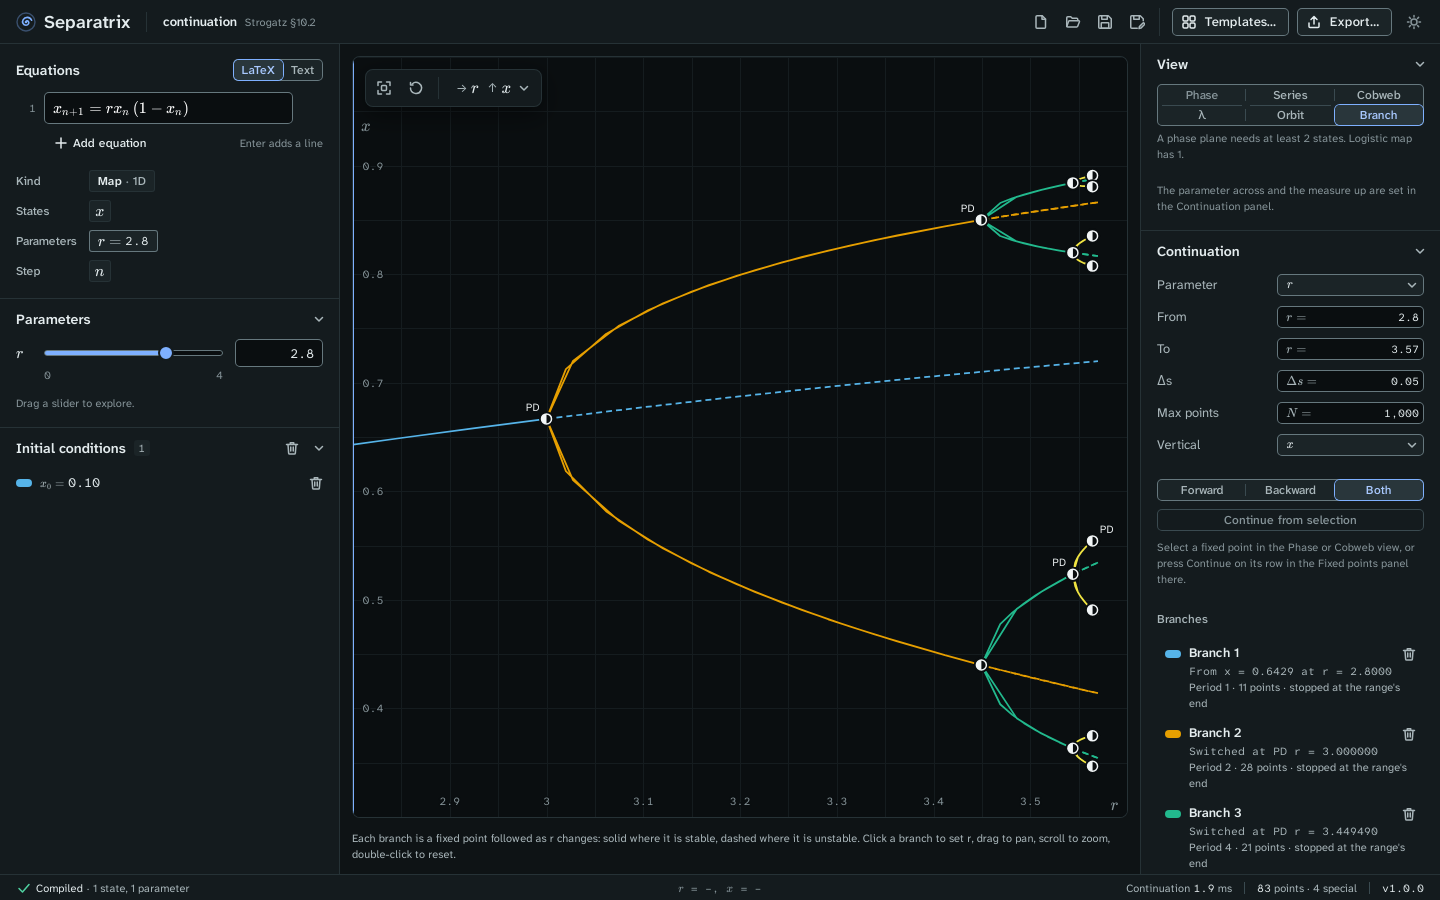
Example project: continuation.sepx, the logistic map for r from 2.8 to 3.57. Branch 1 is the fixed point. Branches 2 and 3 were switched onto at its flips, and follow the 2-cycle and the 4-cycle.
Read the plot
The parameter runs across and a state, or ‖x‖, runs up. Each branch has its own color.
- A solid line is stable, and a dashed line is unstable.
- Every point of a cycle is drawn, so a 2-cycle is two curves.
- Each special point is a fixed-point glyph with a label:
| Label | Bifurcation | Found on |
|---|---|---|
| LP | Fold, or limit point | Flows and maps |
| H | Hopf point | Flows |
| BP | Branch point, where two branches cross | Flows and maps |
| PD | Flip, or period doubling | Maps |
| NS | Neimark–Sacker point | Maps |
Click a branch to set the parameter to that point. The slider and the other views follow.
Start a branch
When you switch to Branch, a branch starts from the selected fixed point, or from every fixed point in view when none is selected. To add a branch from one fixed point, do one of these:
- In the Phase or Cobweb view, click the fixed point's row in the Fixed points panel and click Continue. Separatrix switches to the Branch view and follows it.
- Select a fixed point in the Phase or Cobweb view, switch to Branch, and click Continue from selection.
Set the continuation
| Field | Meaning |
|---|---|
| Parameter | The parameter that changes. |
| From, To | The range a branch may cover. |
| Δs | The first step along the branch, in arclength. Steps grow to twice it where the branch is straight. |
| Max points | The most points of a branch in each direction. |
| Vertical | The state on the vertical axis, or ‖x‖. |
| Forward, Backward, Both | Follow the branch with the parameter increasing, decreasing, or both ways. |
Read the branches and the special points
The Branches list gives each branch's start, its period, its number of points, and why each end stopped. An end stops at the range's end, at Max points, or where a step gets too small to go on. The bin icon removes a branch.
The Special points list gives each bifurcation once, in increasing parameter, with the state and, at a Hopf point, the frequency ω and the first Lyapunov coefficient ℓ₁. A negative ℓ₁ means a supercritical Hopf point, and a positive one a subcritical point. Click a row to set the parameter there.
At a BP or PD row, Switch branch follows the second branch both ways. At a flip of the logistic map, that branch is the cycle of twice the period. A point you have already switched at reads "Followed as Branch k" instead.
At an LP, H, BP, PD or NS row, Follow in two parameters… frees a second parameter and follows the bifurcation in the Parameter plane. Search in two parameters, in the Special points header, follows all of them.
Check the numbers
The continuation gate checks the same command against closed-form values. Two examples:
- Sel'kov's glycolysis model (Strogatz §7.3) at a = 0.08 has Hopf points at b = 0.346410 and b = 0.848528, which are √0.12 and √0.72, with ω = 0.447214 and 0.894427.
- Switching at each flip of the logistic map gives r₁ … r₄ = 3.000000, 3.449490, 3.544090, 3.564407 in three clicks of Switch branch.
Export
The export dialog writes the branch plot as a pgfplots figure, the special points as a booktabs table with siunitx numbers, and the branches as CSV. See Export figures and data.