Getting started
In this tutorial you open the Van der Pol oscillator, add a trajectory, watch the limit cycle change as you drag a parameter, and then save and export your work. It takes about ten minutes. If Separatrix is not installed yet, follow the install guide for Windows, macOS or Linux.
Open an example
Start Separatrix. The template gallery opens with 31 examples from Strogatz's Nonlinear Dynamics and Chaos, grouped by chapter. Each card names the section of the book it comes from.
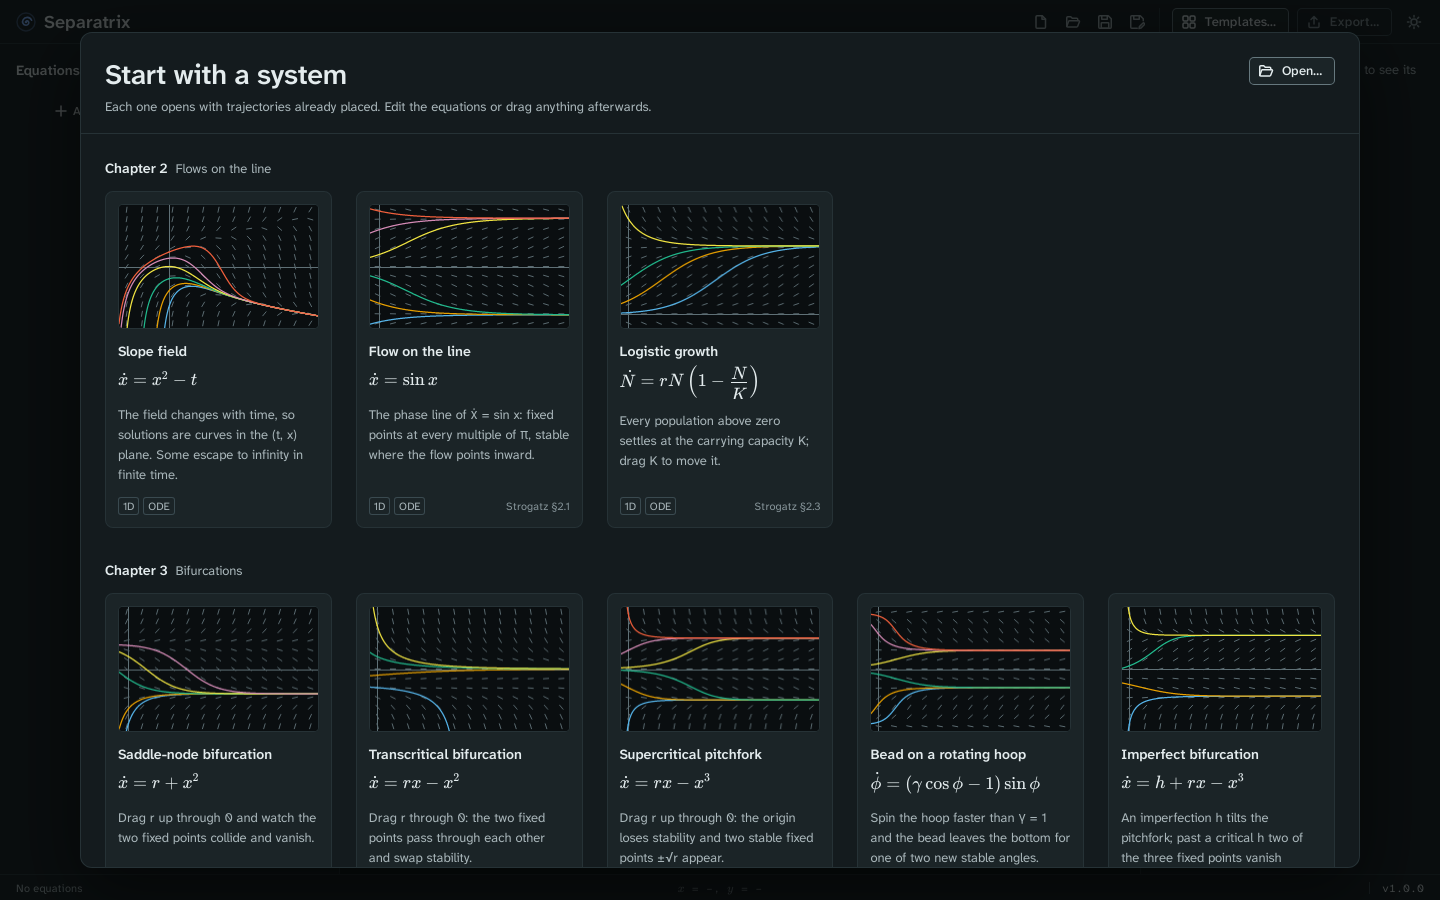
- Scroll to Chapter 7.
- Click Van der Pol oscillator.
The gallery closes and the phase plane opens. You see three areas:
- The left panel holds the Equations, the Parameters and the Initial conditions.
- The middle holds the plot, with a toolbar in its top left corner and a legend under it.
- The right panel, the inspector, holds Layers, View, Solver, Fixed points and Trajectories.
The status bar at the bottom says whether the equations compiled, where the pointer is in plot coordinates, how long the last computation took, and the app's version.
Add a trajectory
- Click anywhere on the plot. A new trajectory starts at that point and winds onto the limit cycle.
- Drag the start point, the ringed dot at the start of the curve. The trajectory follows the pointer.
- Scroll over the plot to zoom. Drag empty space to pan. Double-click to go back to the starting view.
The open circle at the origin is the fixed point. It is open because it is unstable. The Fixed points panel lists it with its eigenvalues.
Drag a parameter
In the Parameters panel, drag the μ slider. Every trajectory is recomputed as you drag. As μ grows, the limit cycle changes from a near circle into the relaxation oscillation of Strogatz §7.5.
To type an exact value, click the number box beside the slider. To change the slider's range, click the minimum or the maximum under it.
Look at the same system over time
In the View panel, click Series. The plot now shows x against t for each trajectory. Click Phase to go back. Time series explains the view.
Save and export
- Press Ctrl+S (⌘S on a Mac) and choose a file name. Separatrix saves a
.sepxproject file that holds the equations, parameters, start points and view. The top bar now shows its name. - Press Ctrl+E (⌘E on a Mac). The export dialog opens with LaTeX and Figure selected.
- Click Copy LaTeX and paste the result into your document. It needs the
pgfplotspackage, which the first lines of the snippet name.
Next steps
- Enter your own equations.
- Try the other views: phase plane, cobweb, 3D view, Poincaré section, Lyapunov spectrum, orbit diagram, continuation and the Parameter plane.
- Before a lecture, switch on projector mode.
- To open the gallery again, click Templates… at the top of the window.