Cobweb
The cobweb view draws the graph of a one-dimensional map xn+1 = f(xn), the diagonal
xn+1 = xn, and the staircase of each orbit between them (Strogatz §10.1). Choose Cobweb in
the View panel. It is offered only for a one-dimensional map that does not depend on n.
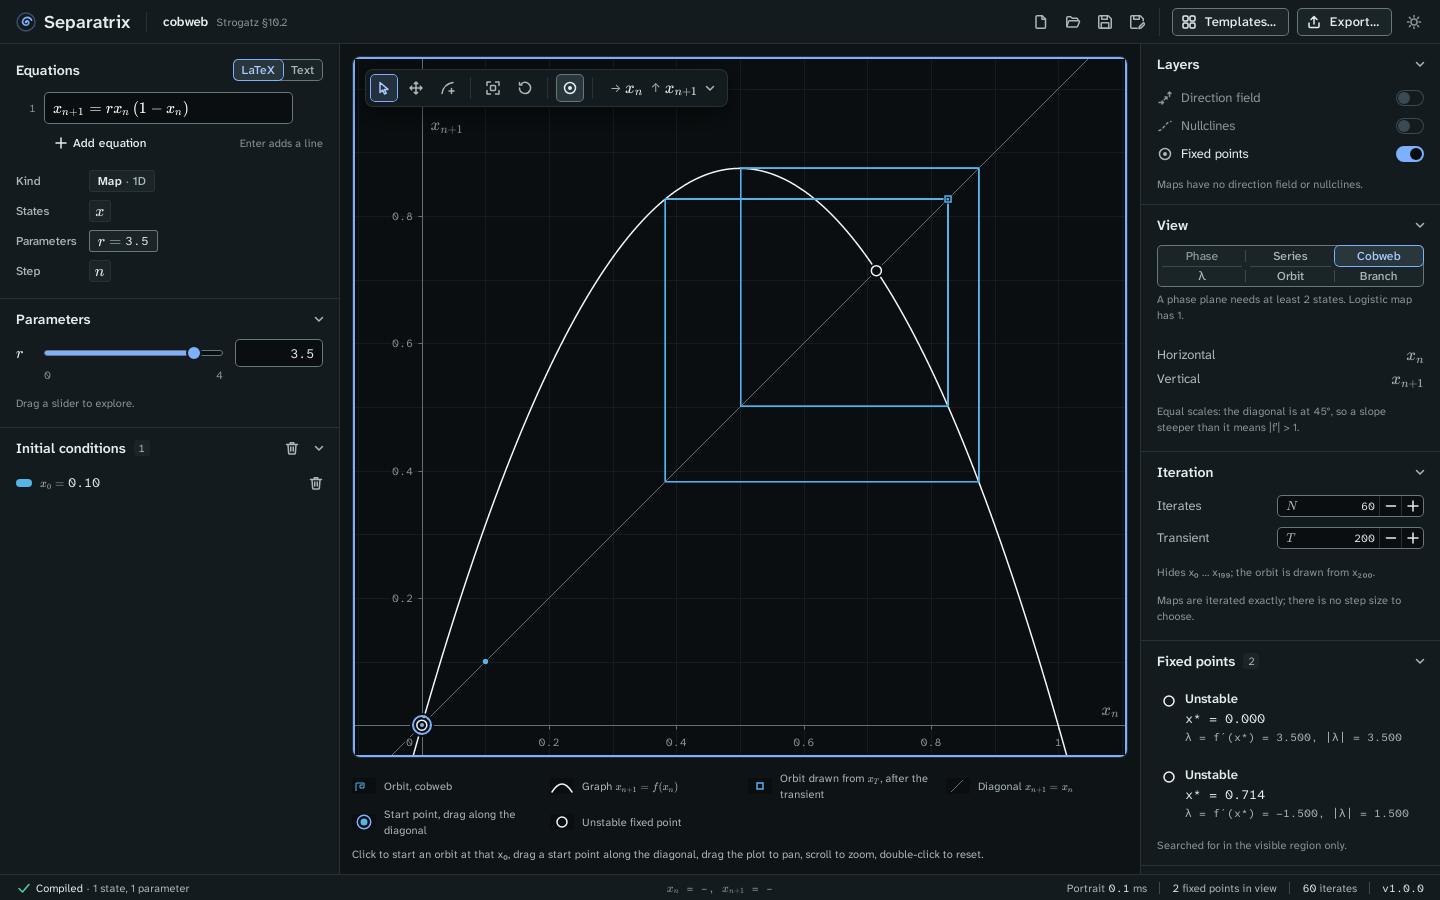
Example project: cobweb.sepx, the logistic map xn+1 = r xn (1 − xn) at r = 3.5, with a transient of 200 iterates hidden. What remains is the attracting 4-cycle, since r = 3.5 lies between the period doublings r₂ = 3.449490 and r₃ = 3.544090.
Read the plot
| Mark | Meaning |
|---|---|
| Curve | The graph of f. |
| Thin diagonal | xn+1 = xn. Fixed points lie where the graph crosses it. |
| Staircase | An orbit, going up to the graph, across to the diagonal, and up again. |
| Square on the diagonal | The first iterate drawn after the transient, xT. |
| Ringed dot | The start point x₀. Drag it along the diagonal. |
| Filled or open circle | A stable or unstable fixed point. |
The axes have equal scales, so the diagonal is at 45°. Where the graph is steeper than the diagonal, |f′| > 1.
Start and move orbits
- Click the plot to start an orbit at that x₀.
- Drag a start point along the diagonal.
- With the plot focused, the arrow keys move a cursor along the diagonal, and Enter starts an orbit there.
Set the iterates
The Iteration panel sets:
- Iterates N, the number of steps drawn.
- Transient T, the number of steps hidden first. With T = 200, the orbit is drawn from x₂₀₀.
A map is iterated exactly, so there is no step size to choose.
Read the fixed points
The Fixed points panel lists each fixed point x* with its multiplier λ = f′(x*) and |λ|. A fixed point is stable when |λ| < 1. At a kink of f, where f′(x*) does not exist, the panel says so.
To see the same map as r changes, switch to the orbit diagram. To follow one fixed point and its period doublings, switch to continuation.