Poincaré section
A Poincaré section shows where a flow's orbits cross a plane, one dot per crossing (Strogatz §8.7). Choose Section in the View panel. It is offered for any flow.
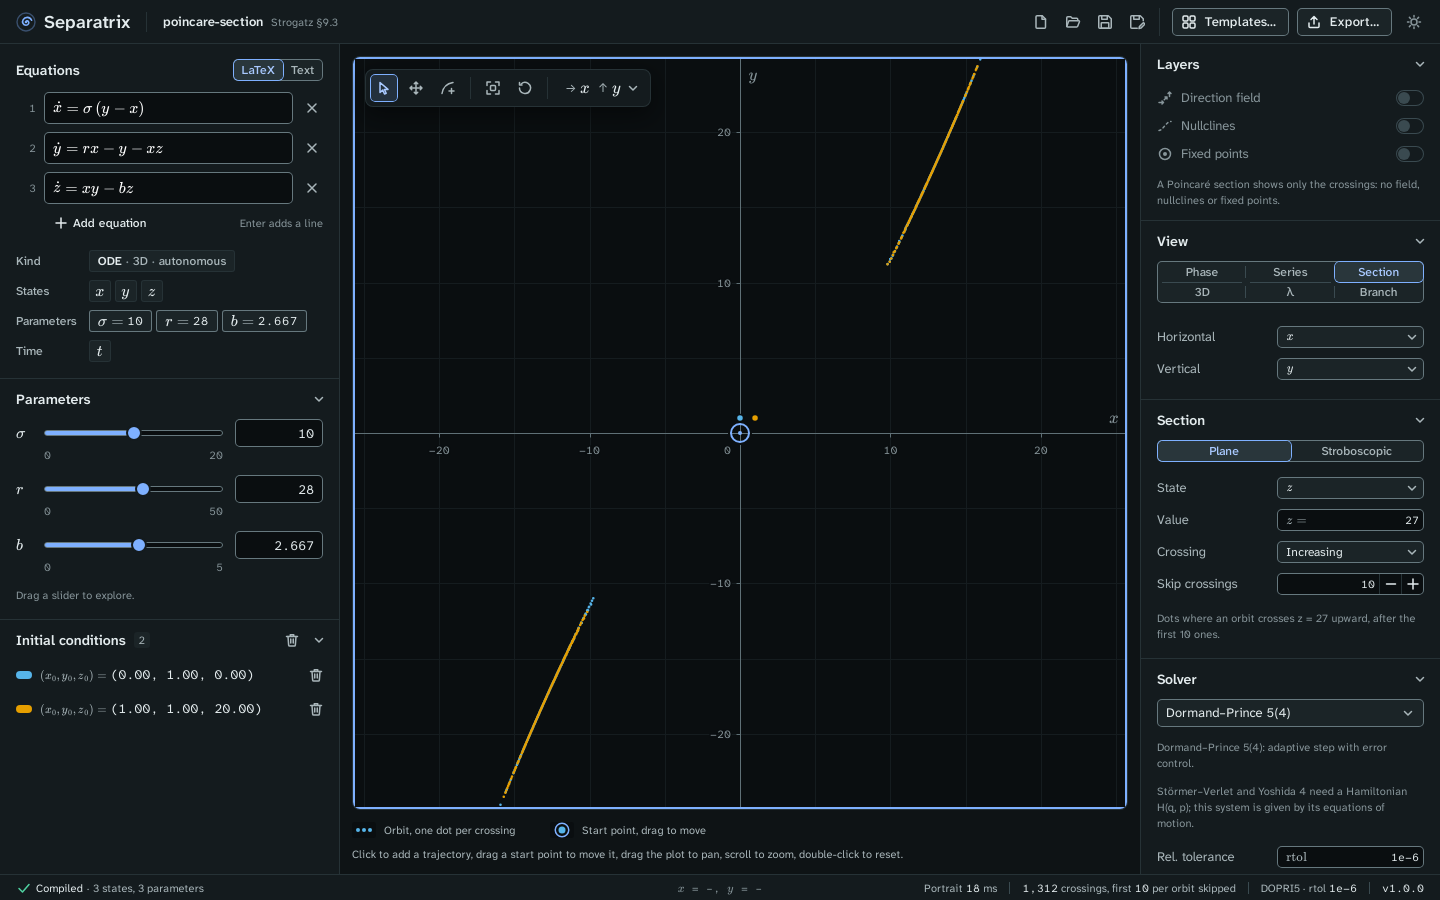
Example project: poincare-section.sepx, the Lorenz equations cut by the plane z = 27, counting the crossings where z increases and skipping the first 10 of each orbit. The dots lie along two short curves, one for each wing of the attractor.
Choose the kind of section
The Section panel has two kinds.
- Plane holds one state at a value. Choose the State, its Value, and the Crossing direction: Increasing, Decreasing or Both. A plane needs a flow with at least two states.
- Stroboscopic samples the state once per forcing period, at t = phase + k·period for
k = 0, 1, 2 and so on. Use it for a forced oscillator, whose equations contain
t. Set the Period and the Phase.
Skip crossings hides the first crossings of each orbit, so the attractor stands out from the transient. The status bar counts the crossings drawn.
Plot a return map
To plot the return map xk → xk+1, choose the same state on both axes. The vertical axis then shows the next crossing, xk+1. A fixed point of the return map is a closed orbit of the flow.
The gallery's forced oscillator (Strogatz §8.7) opens as a stroboscopic return map. Its Poincaré map has the fixed point x* = −A/2, and the Strogatz gate measures −0.500000 at A = 1.
Add orbits
Click a plane section to start an orbit at that point of the plane. On a stroboscopic section, the click starts an orbit at the section's phase. A return map takes no clicks, so add its orbits in another view. A section draws no direction field, nullclines or fixed points.
To see the full orbits, switch to the 3D view or the phase plane.